The OVER/UNDER tool on binarytools.io is a powerful tool that can be used to improve your trading results. It’s a versatile tool that can be used for a variety of different purposes, including identifying trends and harmonic patterns, predicting digits, developing trading strategies, and automating trading strategies with trading bots.
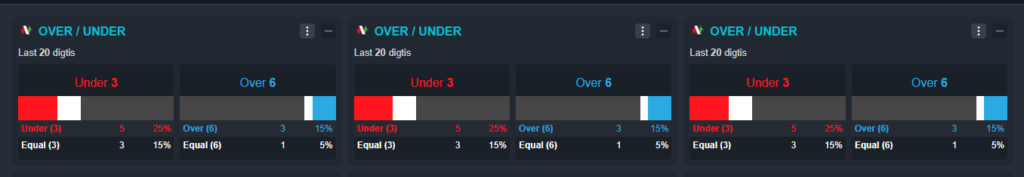
In this new chart we can select how many periods we want to analyze and consult how many were below, and how many were above. The results will be reflected in percentage and amount of digits below, above and also equal to. This graph is popularly used in digit bots strategies and here we bring you 2 strategies that can implement in your trading plan.
Differ Strategy
The differ contracts are those that operate in such a way that the trade is won if the last digit of the market price is different from the digit that is placed as a prediction.
The Over/Under chart is a great complement to this strategy, this chart reflects the data; over, under and equal. In this one we need to focus on EQUAL, it relaxes as the white band and in percentage at the bottom of the chart.
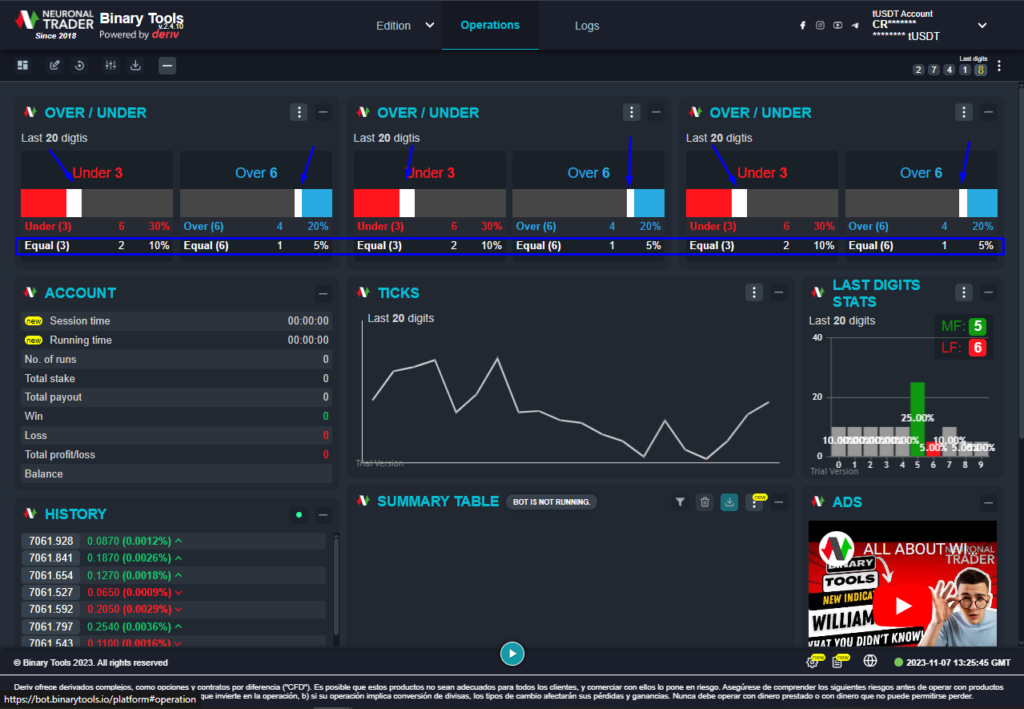
This strategy is based on waiting for the exhaustion of the digit I select for my prediction, when equal reflects percentages equal to or less than 10% or that the white band has the lowest possible volume.
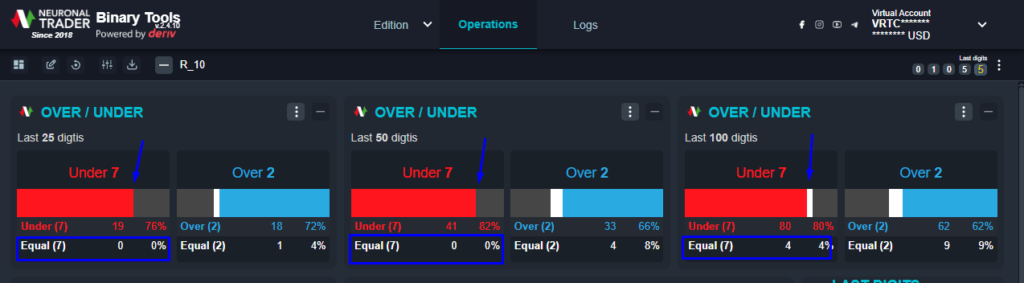
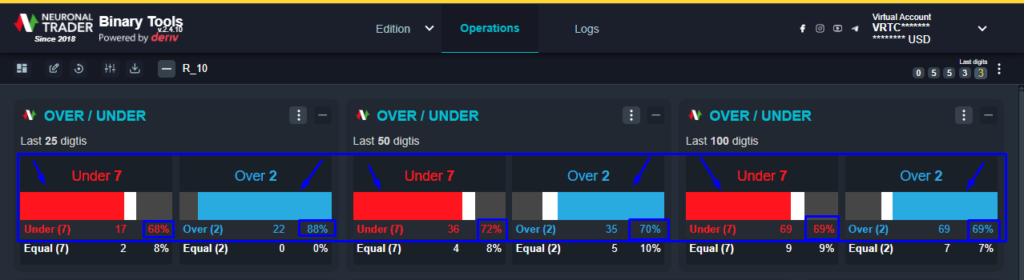
In this case we put as an example values of over 2 and under 7 in 3 different periods, 25 digits, 50 digits and 100 digits, in which we wait for the following scenario to occur.
Here we see that digit 7 has values below 10% in the 3 different periods, so this tells me that at this moment it is less likely that digit 7 will come out and therefore it is a good scenario to execute my bot with the differ contract.
Over/under percentage strategy
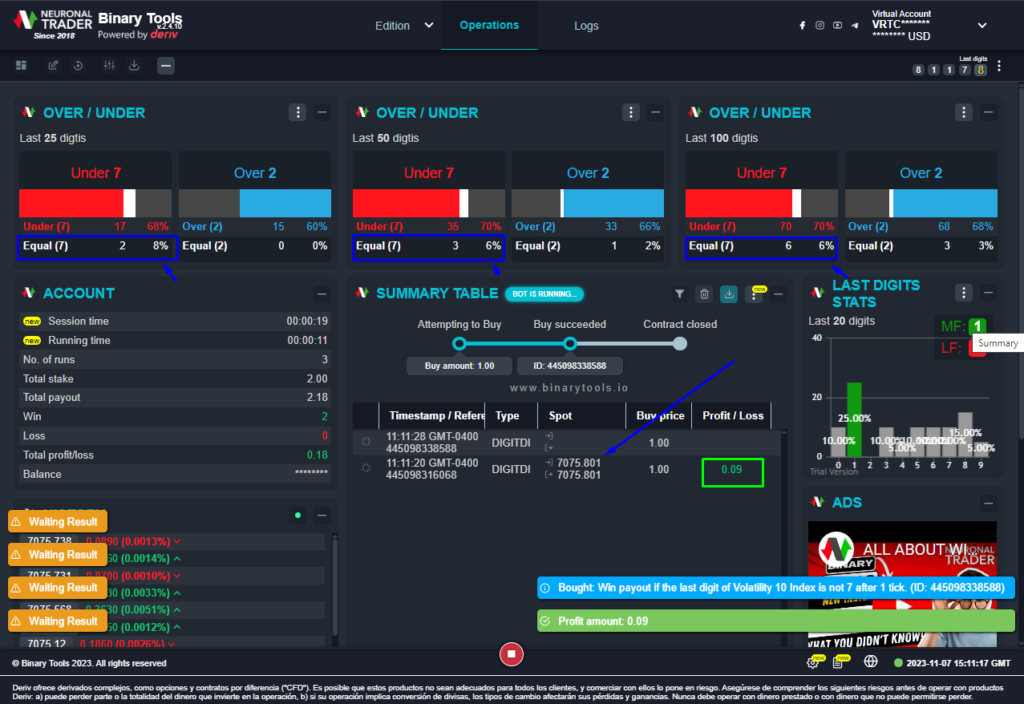
In this case the Over/under tool will help us to analyze in percentages the probability that the last digit of the market price is below or above the prediction that was placed in the bot. Here we will focus on the under (Red) and over (Blue) bar.
So for this example we have as parameters Under 7 and Over 2, that is to say we analyze how many digits below 7 and how many digits above 2 there are in 25 periods, 50 periods and 100 periods. Then this strategy is to wait for these values Over or Under to reflect 80% or more in all these periods, this indicates that the market has a trend inclined towards digits below 7 (6,5,4,3,2,1,0) or in the other case above 2 (3,4,5,6,7,8,9).
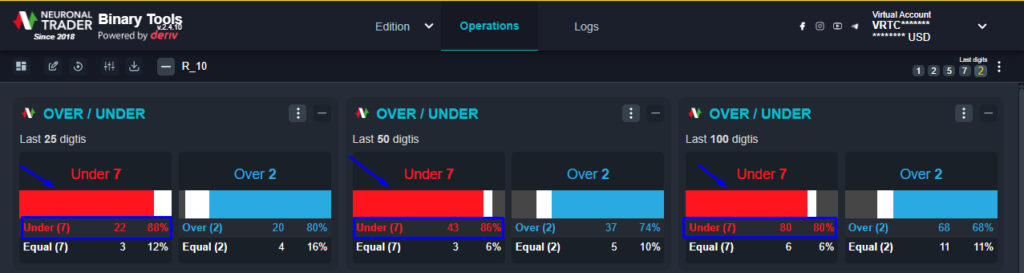
As a complement to this we can also analyze the value of equal to assess or analyze how many digits in that period have been equal to my prediction. therefore the lower the percentage of this the better for the analysis of the strategy.
You can be interesting in “The emotions and the impact on your trading“
If you are interested in learning more about the OVER/UNDER tool on binarytools.io, visiting the binarytools.io and take a lot about how you can automate your trading strategies. And if you are not part of our community yet and want to know more about us, what are you waiting for? Join here!
Important: The information and/or knowledge expressed in this article shouldn’t be taken as investment recommendations or financial advice. All investments and/or actions involve a risk and each person is responsible for researching, educating and analyzing before making an investment decision.


