Automating trading strategies can be a great way to improve your trading performance. However, it is important to do your research and choose a reliable trading platform and a proven trading strategy before you get started. On Binarytools we help you to automate your trading strategies and also give you some ideas to add digits to trading account balance.
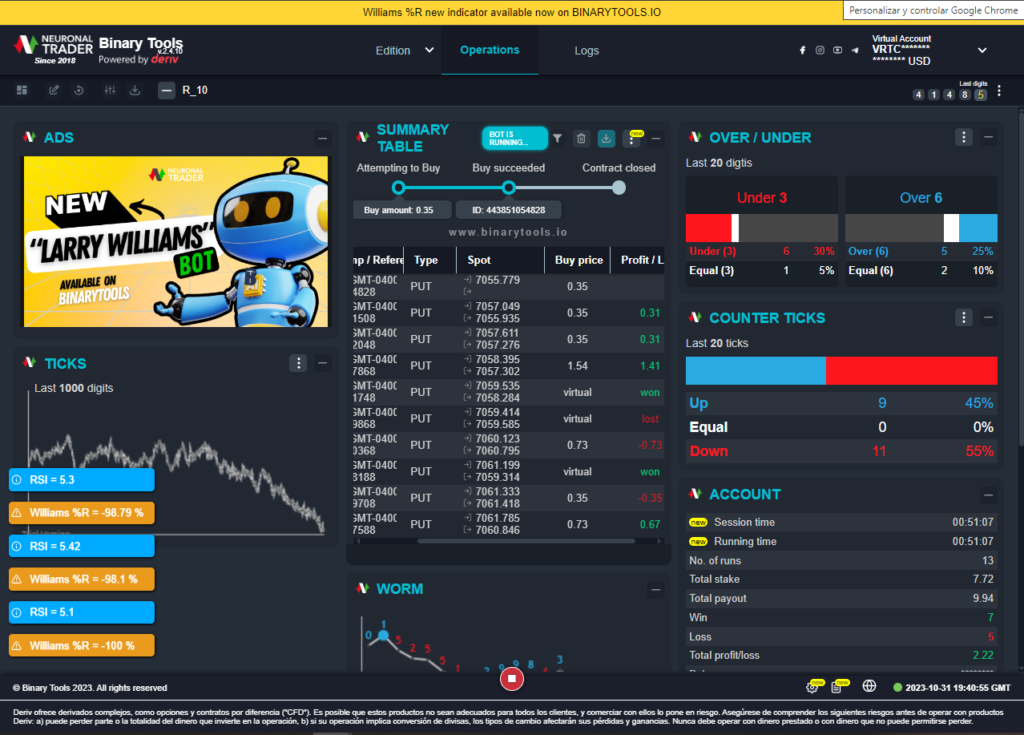
At this time we bring you the Larry Williams Bot that it’s a bot developed by the staff of Neuronaltrader that includes the Williams %R indicator like the principal of this strategy. The Williams %R indicator is a momentum indicator and it’s use it for overbought and oversold of the market, you can find it on the indicator libraries of Binarytools.io
Larry Williams Bot
For the Bot Larry William we have 2 strategy options, when the RSI and Williams Percentage Range indicators indicate an oversold or overbought market we can decide whether to open operations in favor of the trend or against, to make this decision we have to go to the chart, the tradingview and make a technical analysis on market movements, as it is necessary to have confirmations to get right with the movement.
You can be interesting in “All about Williams %R indicator“
Larry Williams Bot “Follow trend” Strategy
The Larry Williams bot have the follow configurations:
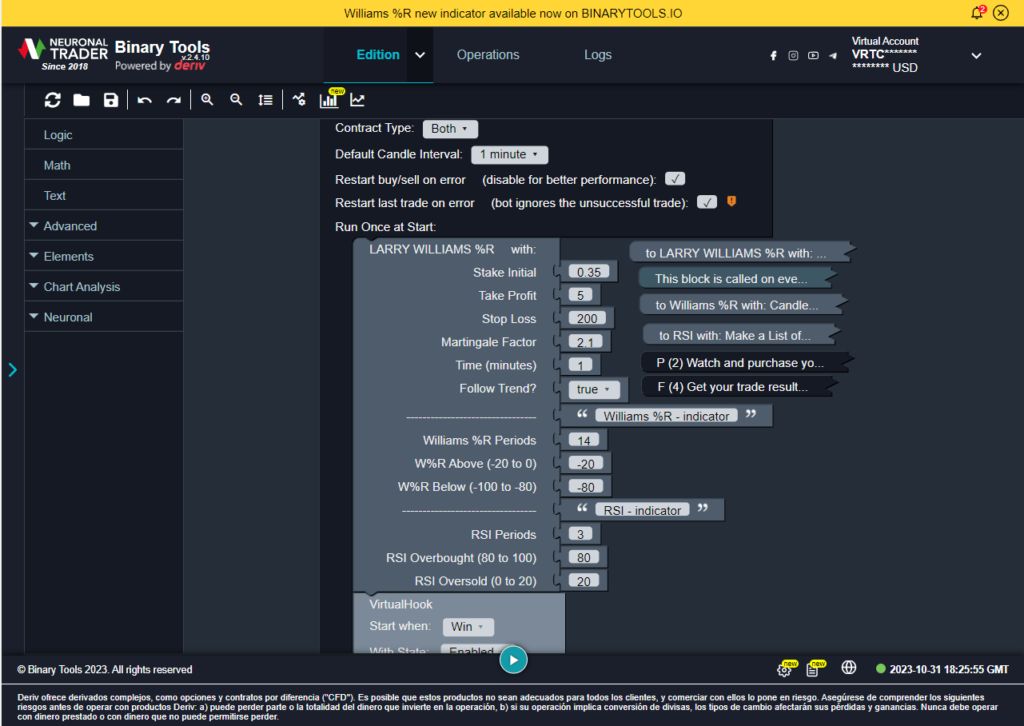
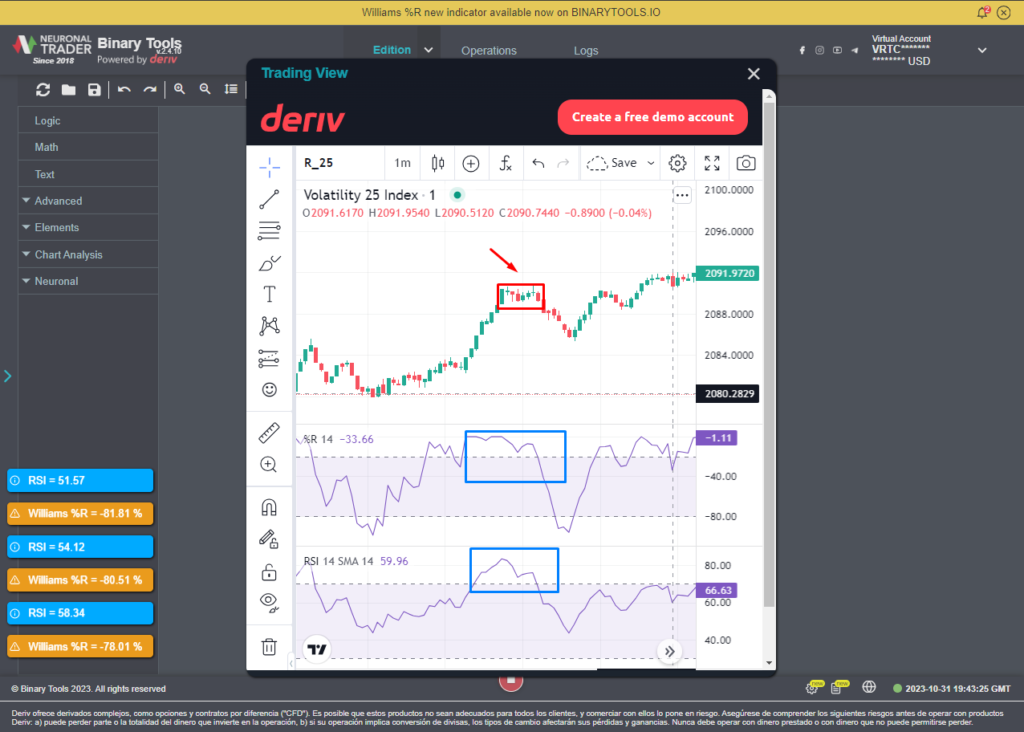
This strategy works as follows, if the Williams %R indicator and the RSI indicator indicate overbought or oversold, the Bot will start executing trades following this trend. It will start executing buy or bullish trades if these indicators show overbought and will make sell or bearish trades if they show oversold.
And in the case that the Williams Percentage Range indicator indicates values of -20 or above and the RSI values of 80 or above, the BOT will execute bullish or buy trades, the bot configuration will open trades of 1 min time frame.
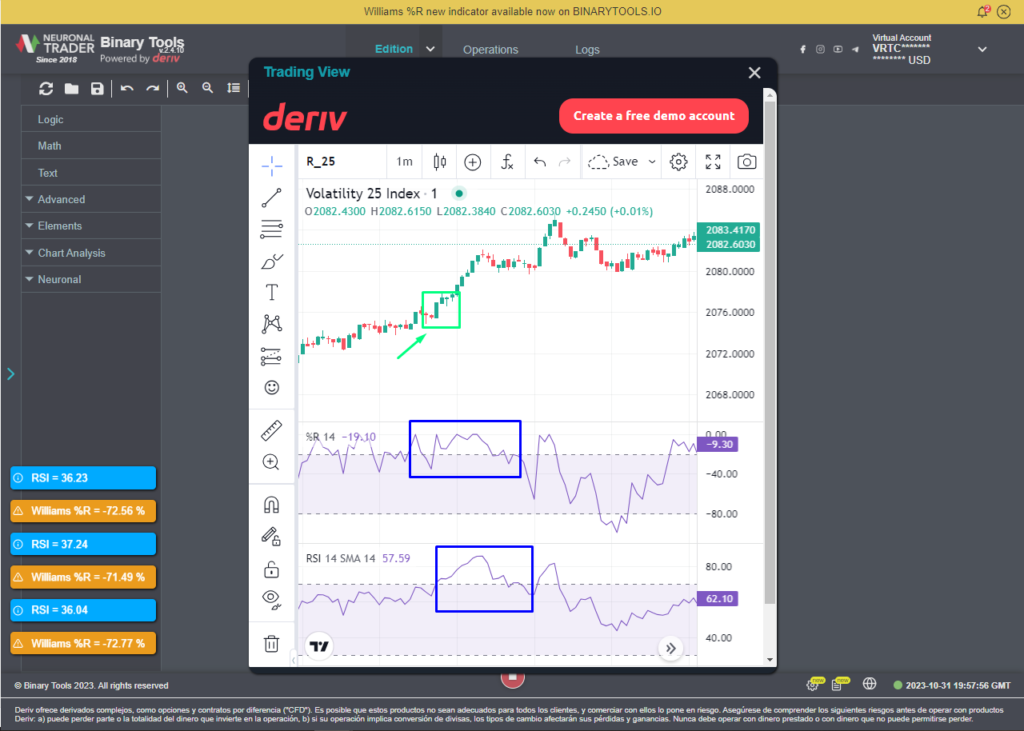
the confirmations that can help us to make the decision to trade in favor of the trend in this strategy are the following:
- Defined trends, market movement should not be within a consolidation range.
- Medium volatility, if we find a very volatile market or with low volume our analysis will be less likely to be accurate.
- Imbalance above the beginning of the operation execution, since the market will seek to mitigate this zone and the trend will have a strong movement in favor of this trend.
- Absence of reaction zones, these would cause the reversal of the trend movement.
Always to execute a trading operation it is important to execute them on a healthy chart, which must have candles with good body, defined trends, movement out of a consolidation movement…
Do you want to know how manage risk on trading? go to “All about the risk management”
Larry Williams Bot “No follow trend” Strategy
The Larry Williams bot have the follow configurations:
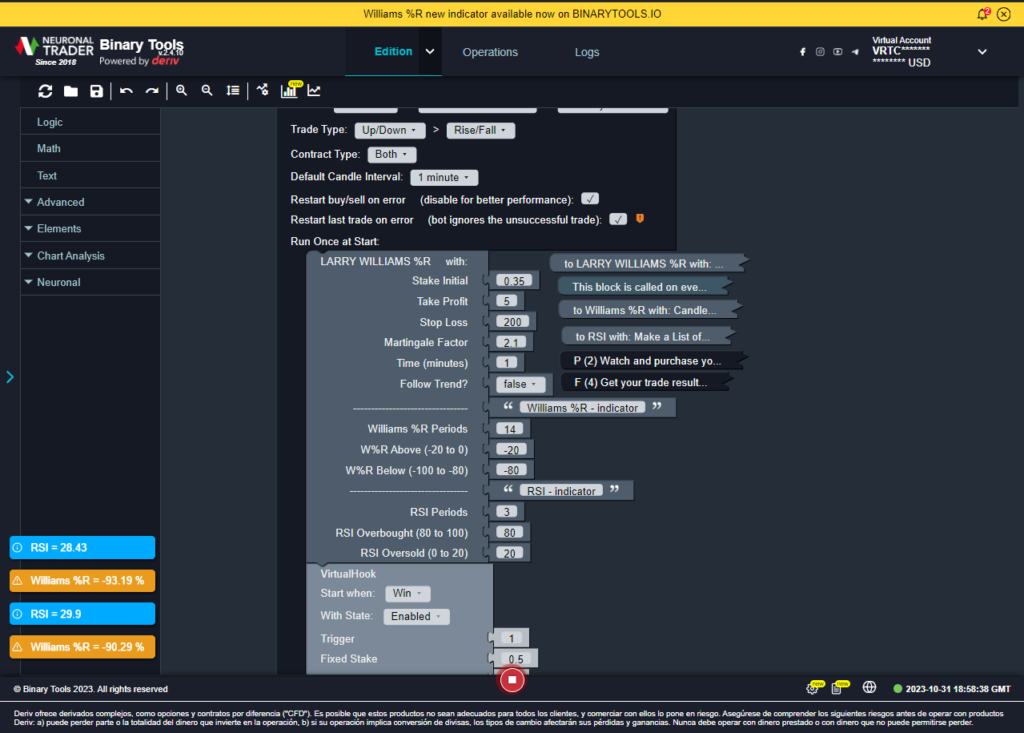
In this case the strategies work the other way around, if the Williams %R indicator and the RSI indicator indicate overbought or oversold, the Bot will start to execute trades that are contrary to this trend, i.e. it will start to execute bullish or buy trades if these indicators are showing overbought and will execute bearish or sell trades if they are showing overbought.
And in the case that the Williams Percentage Range indicator indicates values of -20 or above and the RSI values of 80 or above, the BOT will execute down or sell trades, and these will be trades of 1 min of time just like the previous strategy.
the confirmations that can help us to make the decision to trade against the trend in this strategy are the following:
- Reaction Zones that indicate a change of trend at the moment of executing the bot.
- Mitigation of imbalance zones, the mitigation of which will cause the market to react contrary to the trend it was in.
- Divergences in the RSI indicating an upcoming trend change
- Trend reversal candlestick patterns, such as engulfing candles, inverted hammer or 4-candlestick fractal
- Chart patterns that show me reaction zones
- Medium volatility, if we find a very volatile market or with low volume our analysis will have less probability of being accurate.
Always to execute a trading operation it’s important to execute them on a healthy chart. Which must have candles with good body, defined trends, movement out of a consolidation movement…
It important to let you know that you have to take your own decision, take your analysis and that you can modify the values bot, you can adapt it to your trading plan and your manage of risk, stop loss, profit and others.
Others Signals that can help you to take decisions
RSI Divergence Strategy
This strategy uses divergence between the price and the RSI indicator to generate trading signals.
- Buy Signal: When the price is making higher highs, but the RSI indicator is making lower highs (bullish divergence).
- Sell Signal: When the price is making lower lows, but the RSI indicator is making higher lows (bearish divergence).
It’s important to note that no trading strategy is perfect, and there is no guarantee of profits. It is important to back test any strategy thoroughly before using it in a live trading environment.
Have you not yet used the Larry Williams bot? Go and download here… What are you waiting for?
As a brand, our mission is to innovate and provide quality products to our community. All the Neuronaltrader team keep working hard to continue adding value to your assets!
If you are part of our community and use Binarytools to automatized your strategy, let us know what do you think about this version. Come into the community and know what others user are talking about Binarytools 2.4
Important: The information and/or knowledge expressed in this article shouldn’t be taken as investment recommendations or financial advice. All investments and/or actions involve a risk and each person is responsible for researching, educating and analyzing before making an investment decision.


