The Williams %R indicator is a technical momentum indicator that measures the level of the close relative to the highest high and lowest low over a given period of time. It is a bound oscillator, meaning that its values are always between 0 and -100.
The Williams %R indicator is calculated using the following formula:
Williams %R = (Highest High – Close) / (Highest High – Lowest Low) * -100
Where:
- Highest High is the highest high price over the given period of time.
- Lowest Low is the lowest low price over the given period of time.
- Close is the closing price of the current period.
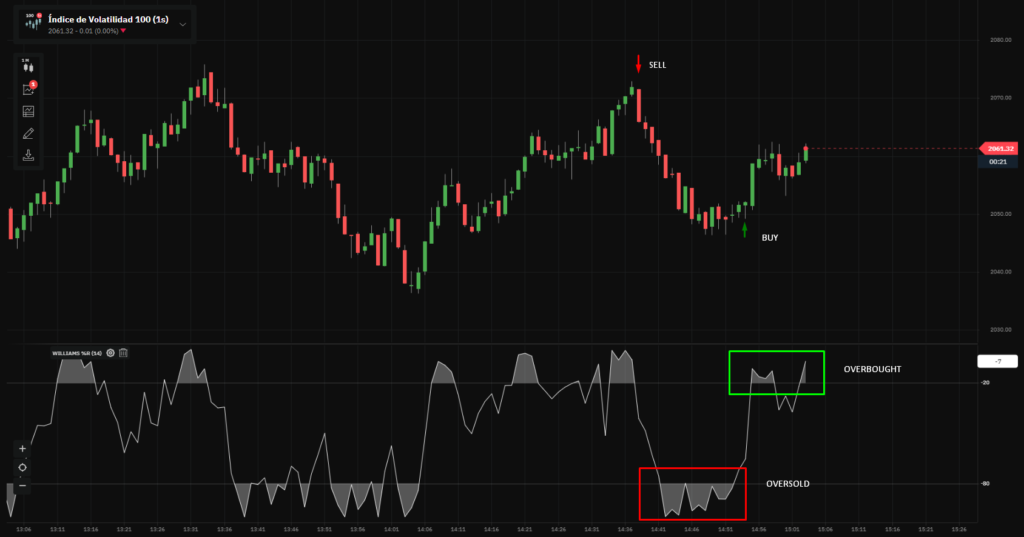
The Williams %R indicator is typically used to identify overbought and oversold conditions. A reading above -20 indicates that the market is overbought and may be due for a pullback. A reading below -80 indicates that the market is oversold and may be due for a rebound.
Traders can also use the Williams %R indicator to identify divergences. A divergence occurs when the price is moving in one direction but the Williams %R indicator is moving in the opposite direction. This can be a signal that a trend reversal may be imminent.
Williams %R indicator in trading strategies
Identify overbought and oversold conditions
One of the most common uses of the Williams %R indicator is to identify overbought and oversold conditions in the market. When the indicator moves above -20, it indicates that the market is overbought and may be due for a pullback. When the indicator moves below -80, it indicates that the market is oversold and may be due for a rebound.
To trade based on overbought and oversold conditions, you can use the following strategy:
- Buy when the indicator moves below -80.
- Sell when the indicator moves above -20.
It is important to note that this strategy can generate false signals, so it is important to use it in conjunction with other technical indicators and fundamental analysis.
Identify divergences
Another way to use the Williams %R indicator is to identify divergences. A divergence occurs when the price is moving in one direction but the indicator is moving in the opposite direction. This can be a signal that a trend reversal may be imminent.
To trade based on divergences, you can use the following strategy:
- Look for a divergence between the price and the indicator.
- Enter a trade in the direction of the divergence.
For example, if the price is making higher highs but the indicator is making lower highs, this could be a signal that a bearish trend reversal is imminent. You could then enter a short trade in the direction of the divergence.
Gauge trend strength
The Williams %R indicator can also be used to gauge the strength of a trend. When the indicator is consistently above -20, it indicates that the trend is strong and bullish. When the indicator is consistently below -80, it indicates that the trend is strong and bearish.
To trade based on trend strength, you can use the following strategy:
- Buy when the indicator is consistently above -20 and the trend is bullish.
- Sell when the indicator is consistently below -80 and the trend is bearish.
It is important to note that no technical indicator is perfect, and the Williams %R indicator is no exception. It should be used in conjunction with other technical indicators and fundamental analysis to make informed trading decisions.
Here are some additional tips for using the Williams %R indicator in your trading strategies:
- Use a longer lookback period for the indicator to generate more reliable signals.
- Combine the Williams %R indicator with other technical indicators, such as moving averages and trendlines.
- Use the Williams %R indicator to identify potential entry and exit points, but do not rely on it solely to make trading decisions.
I hope this information is helpful. Please let me know if you have any other questions.
what are you waiting for? Join here!
Important: The information and/or knowledge expressed in this article shouldn’t be taken as investment recommendations or financial advice. All investments and/or actions involve a risk and each person is responsible for researching, educating and analyzing before making an investment decision.


