Come and know the new features of Binarytools 2.4 the best platform to automate your trading strategies, the version that let you to take the control.
The new charts
Some of the new features that we integrate on the new version of Binarytools are some new charts that will help you on your analysis and trading strategies. Stay and take a look:
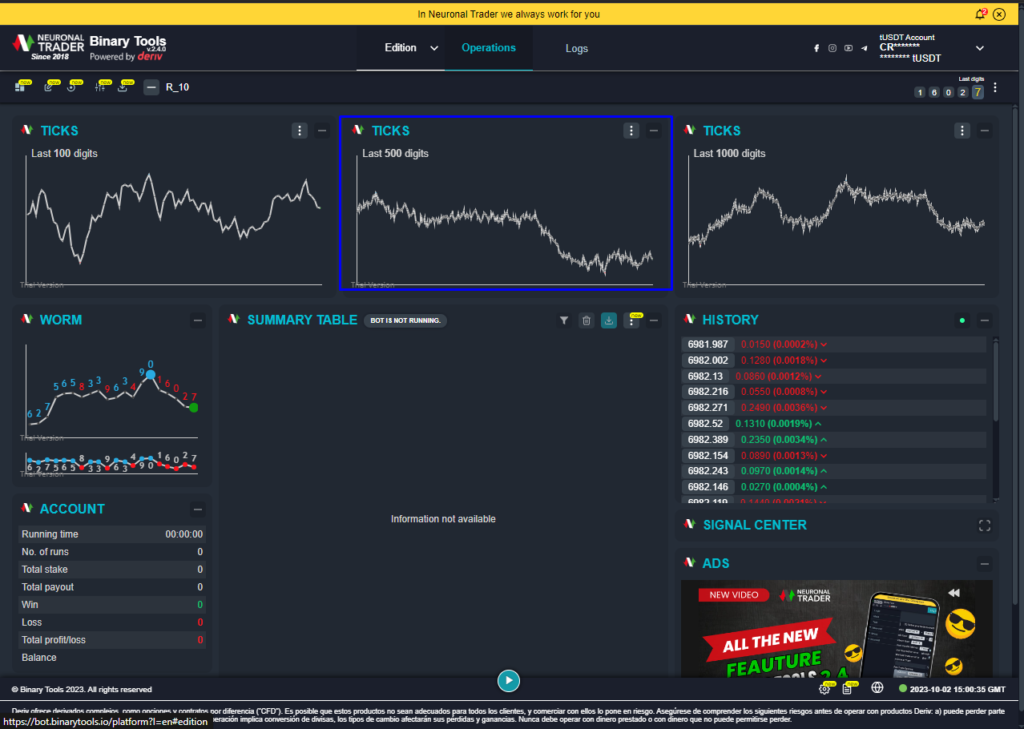
Ticks Chart
The ticks chart is like the worm chart but in this one we can analyze a wider range of ticks. It works for technical analysis such as supports, floors, consolidations and more.

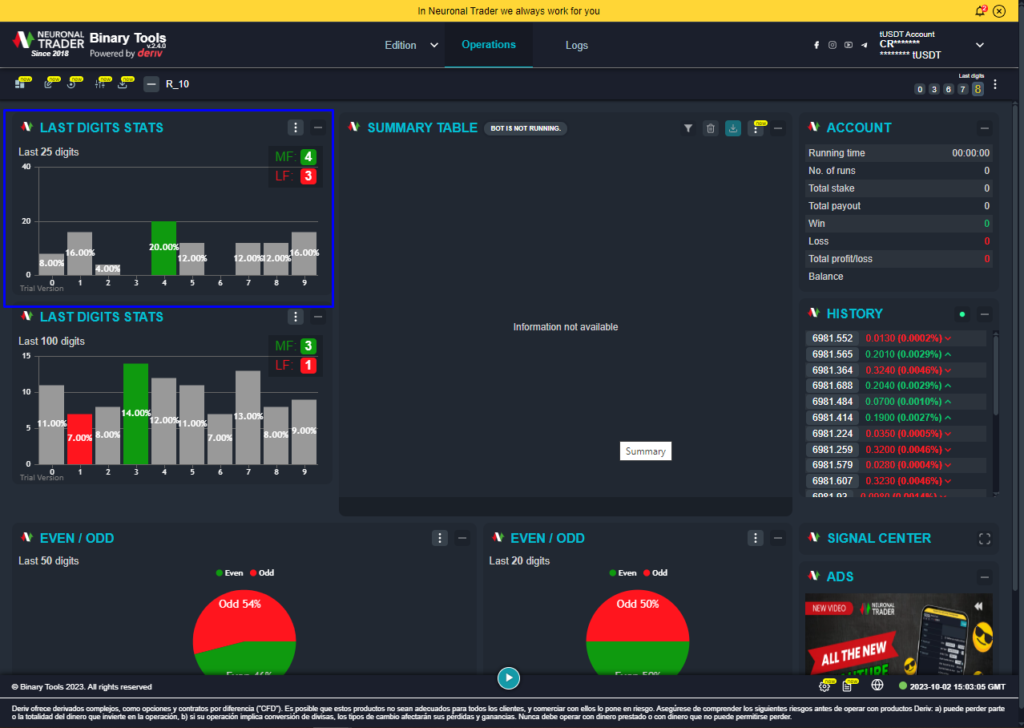
Last Digits Stats Chart
This new chart shows a percentage bar graph of the 10 digits, from 0 to 9. The most frequent is reflected in green and the least frequent in red. This would help us in strategies such as spread or range.

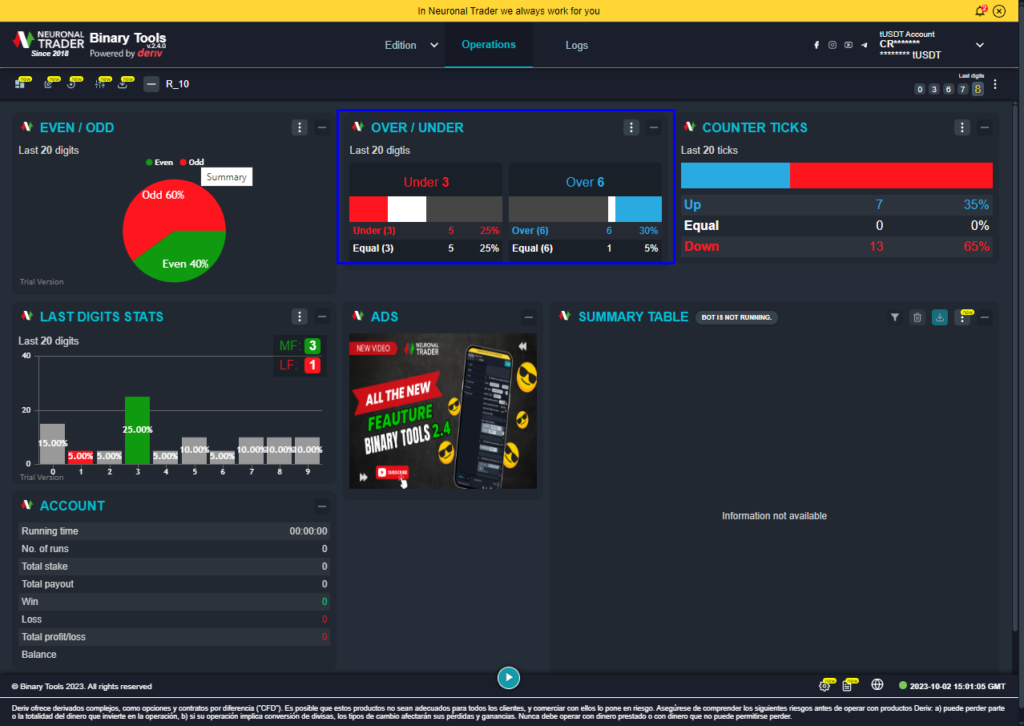
Over/Under Chart
In this new chart we can select how many periods I want to analyze and consult how many were below, and how many were above. The results will be reflected in percentage and amount of digits below, above and also equal to.

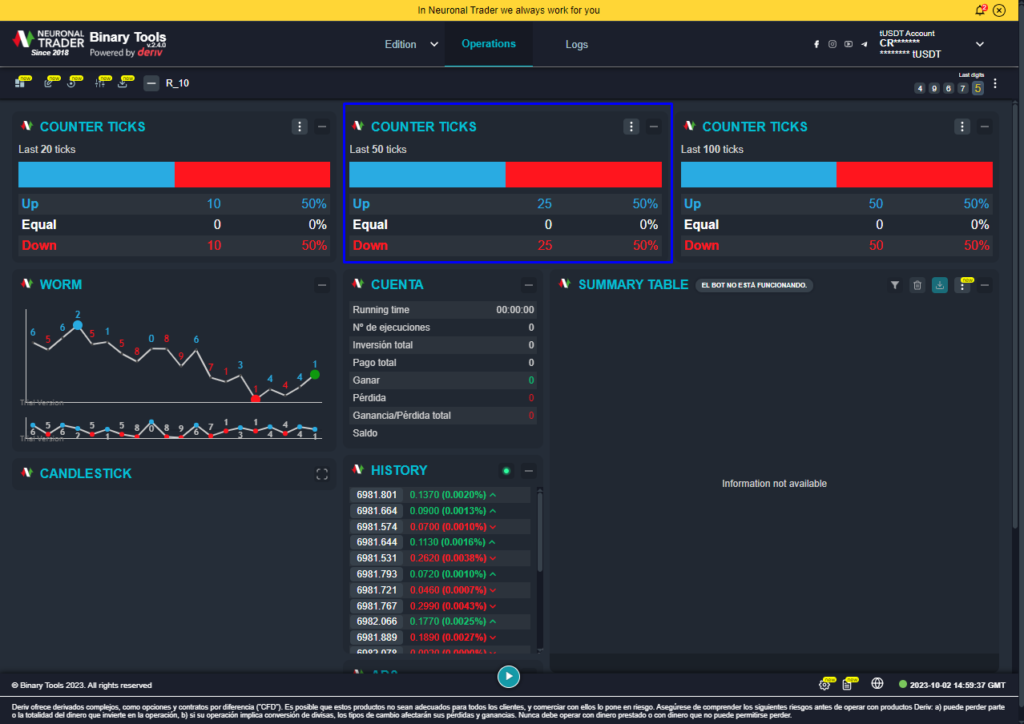
Counter ticks Chart
It counts how many ticks were bullish and how many were bearish in the selected period. The result is reflected in percentage and number of bullish and bearish ticks.

If you want to know how to add this charts to your operation module click here!
Your opinion is important
As a brand, our mission is to innovate and provide quality products to our community. All the Neuronaltrader team keep working hard to continue adding value to your assets!
If you are part of our community and use Binarytools to automatized your strategy. Let us know what do you think about this version. Come into the community and know what others user are talking about Binarytools.
what are you waiting for? Join here!
Important: The information and/or knowledge expressed in this article shouldn’t be taken as investment recommendations or financial advice. All investments and/or actions involve a risk and each person is responsible for researching, educating and analyzing before making an investment decision.


