Get to know the new Charts
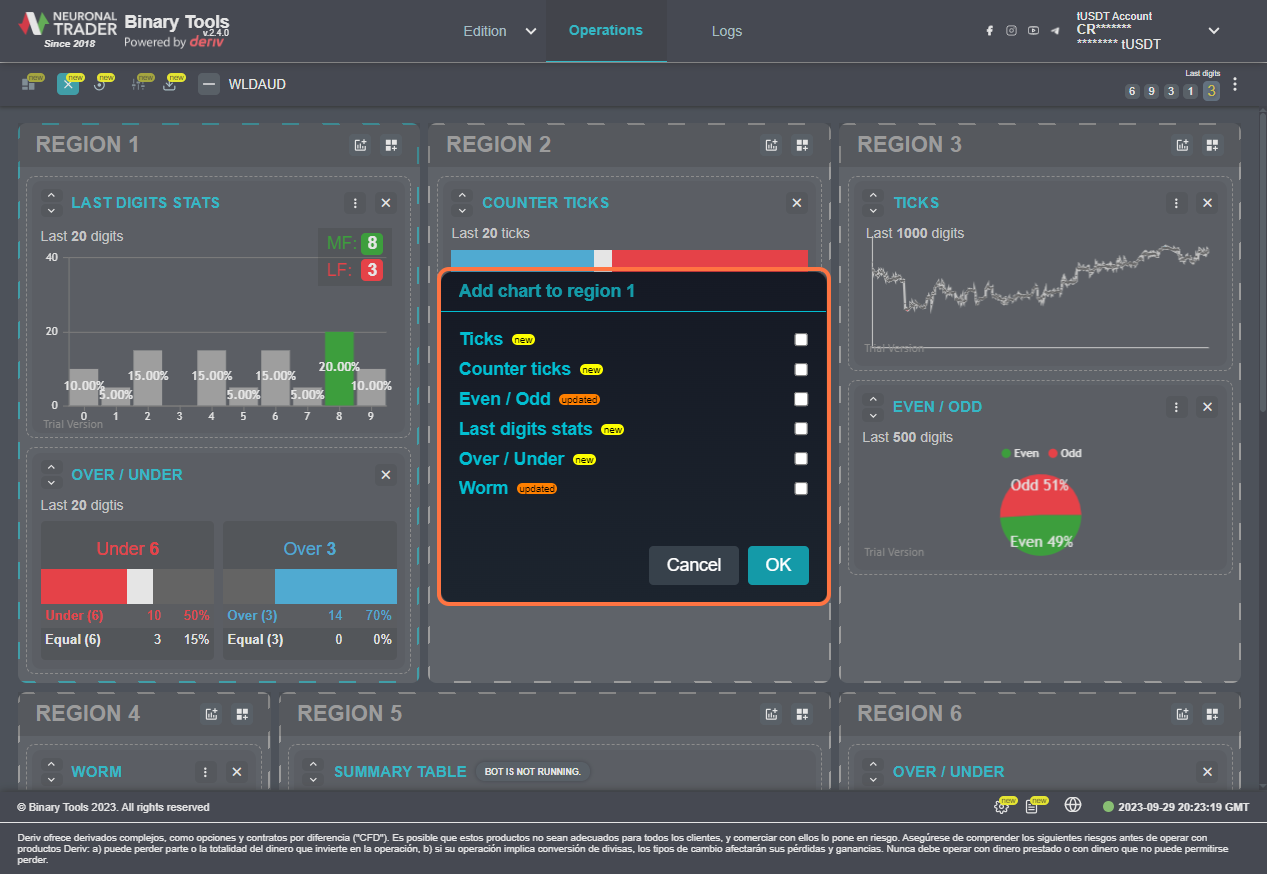
1. Click on Add chart to region 1…
In this new version 4 new charts have been added
-Ticks
-Counter ticks
-Last digits stats
-Over / Under
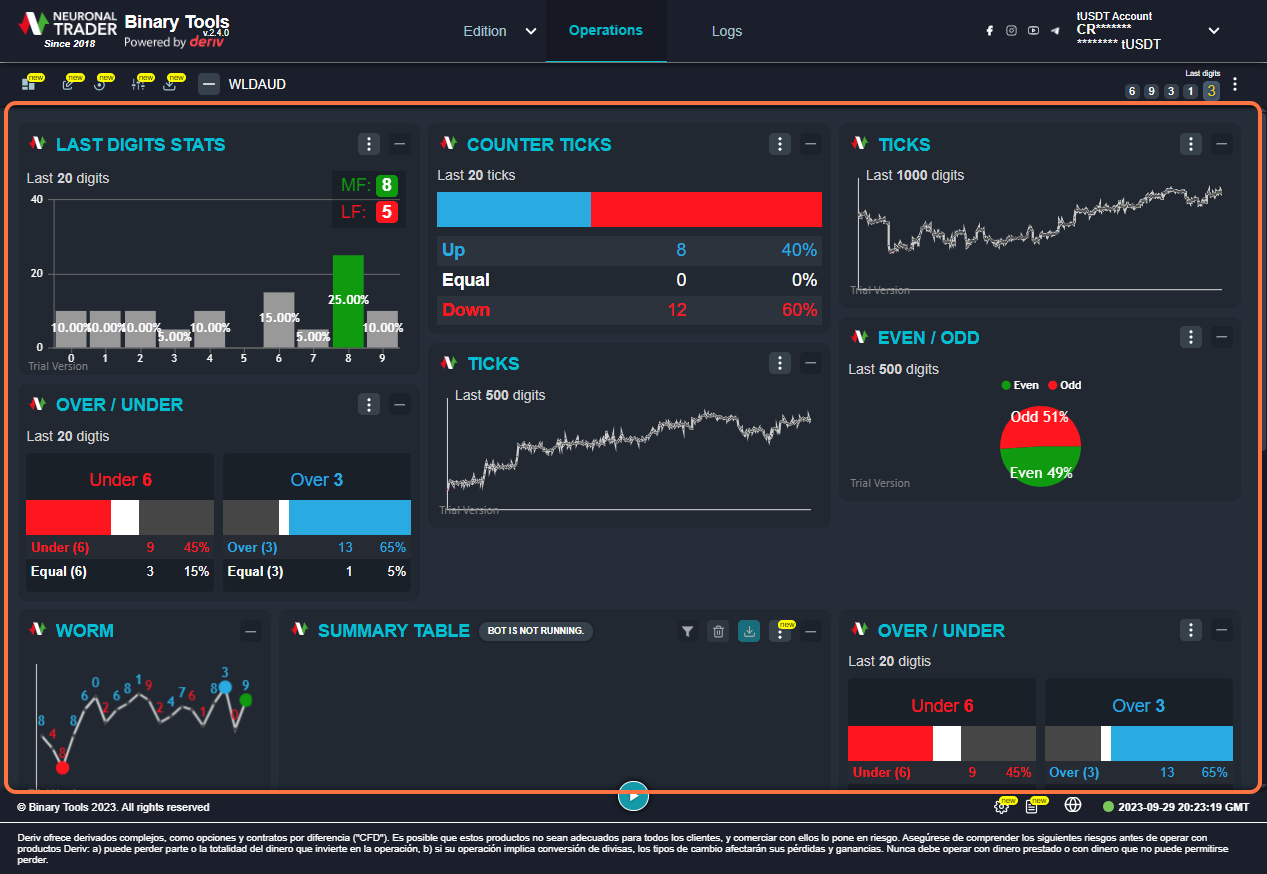
2. Click on LAST DIGITS STATS…
The Charts have the option to configure the periods and size in height.
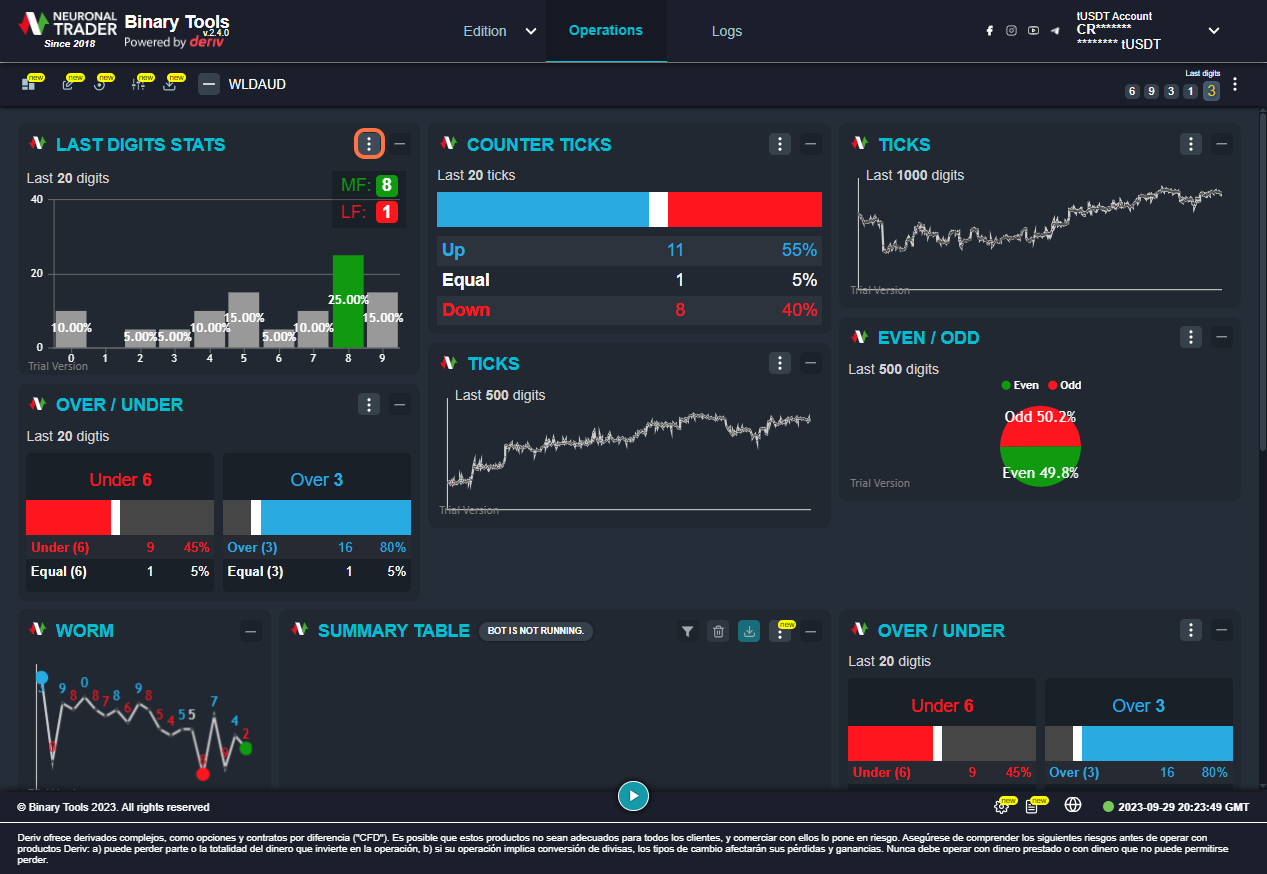
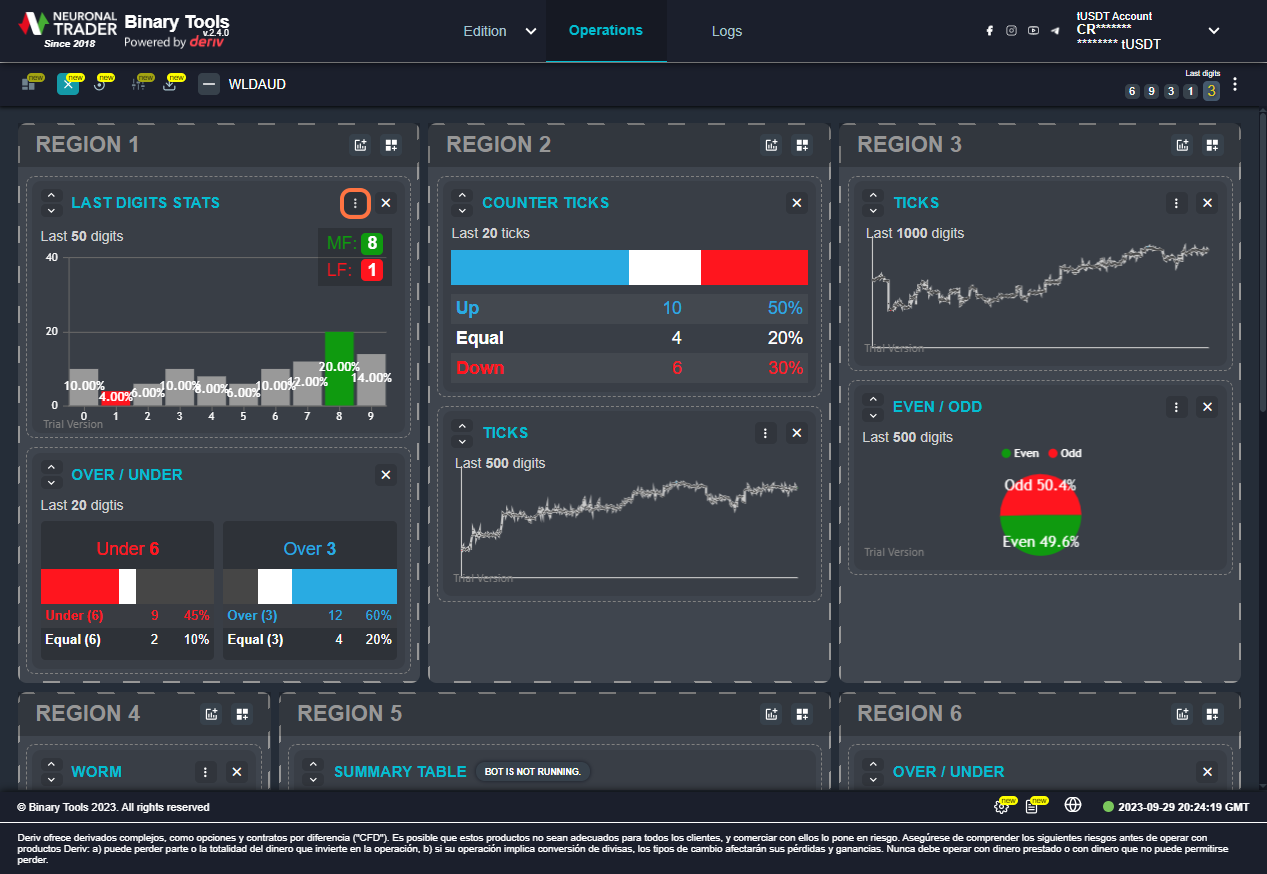
3. Click on highlight
To configure the periods, click on the Summary icon at the top of each chart.
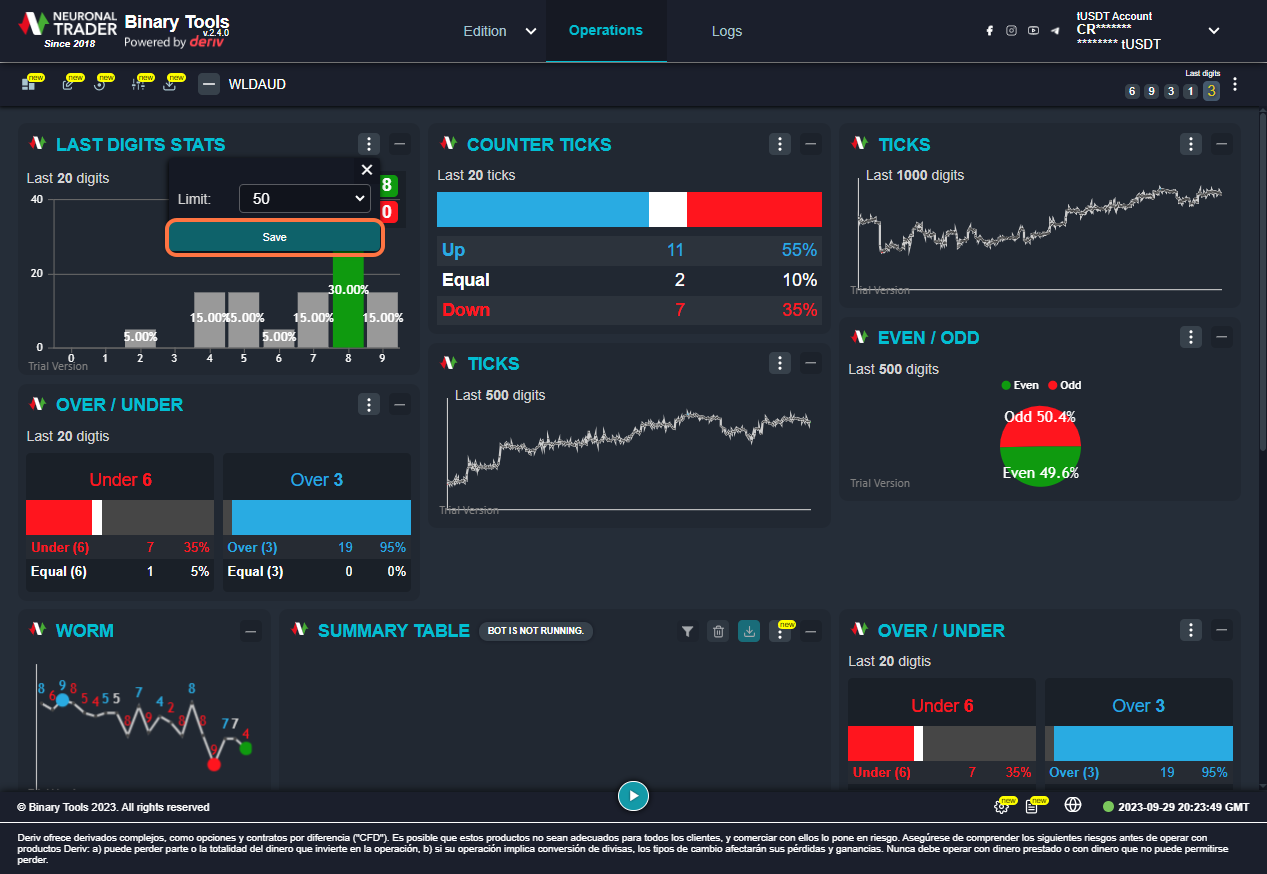
4. Select 50 from Limit:
It has predetermined periods ranging from 20 to 1000 in the different charts.
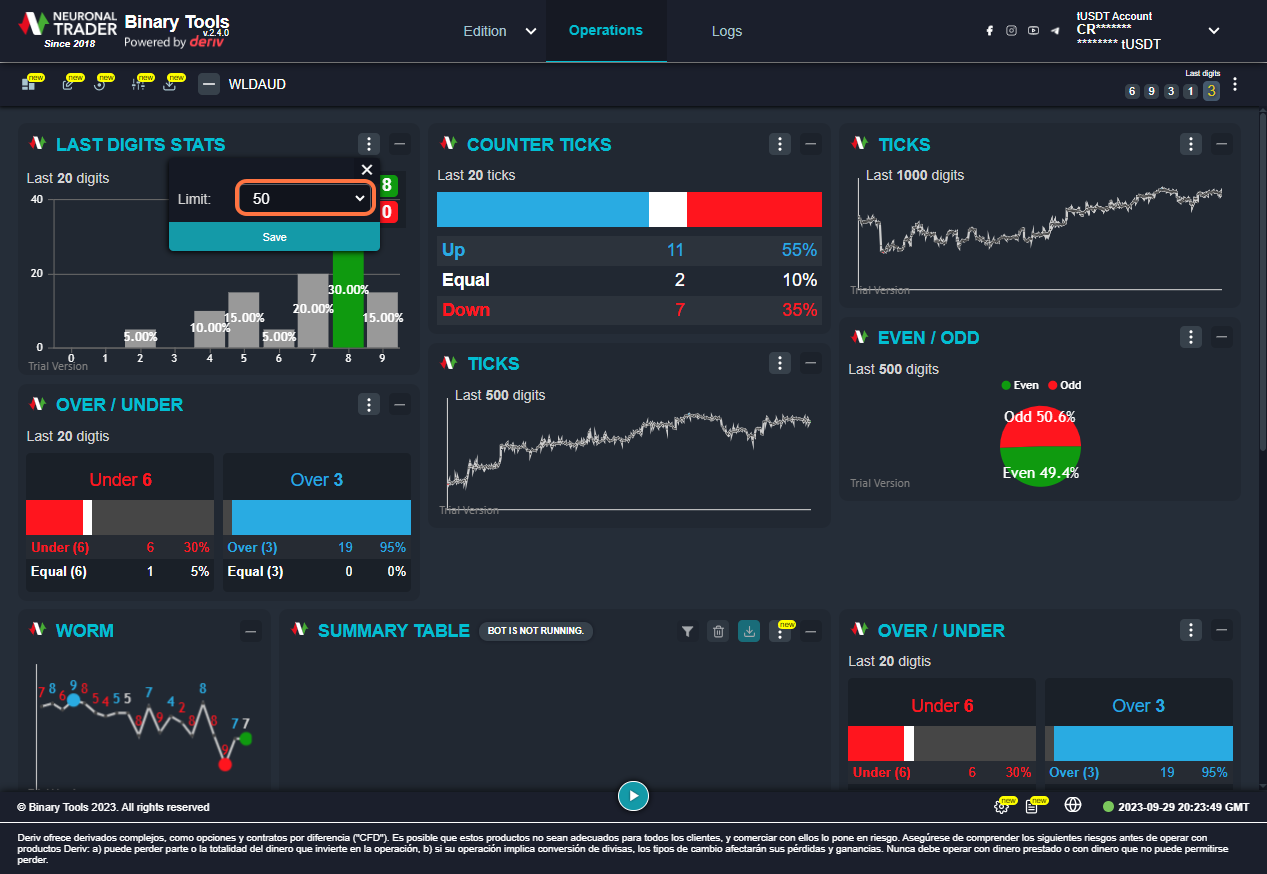
5. Click on Save
Select the period that best suits your style and confirm by clicking on the “SAVE” button.
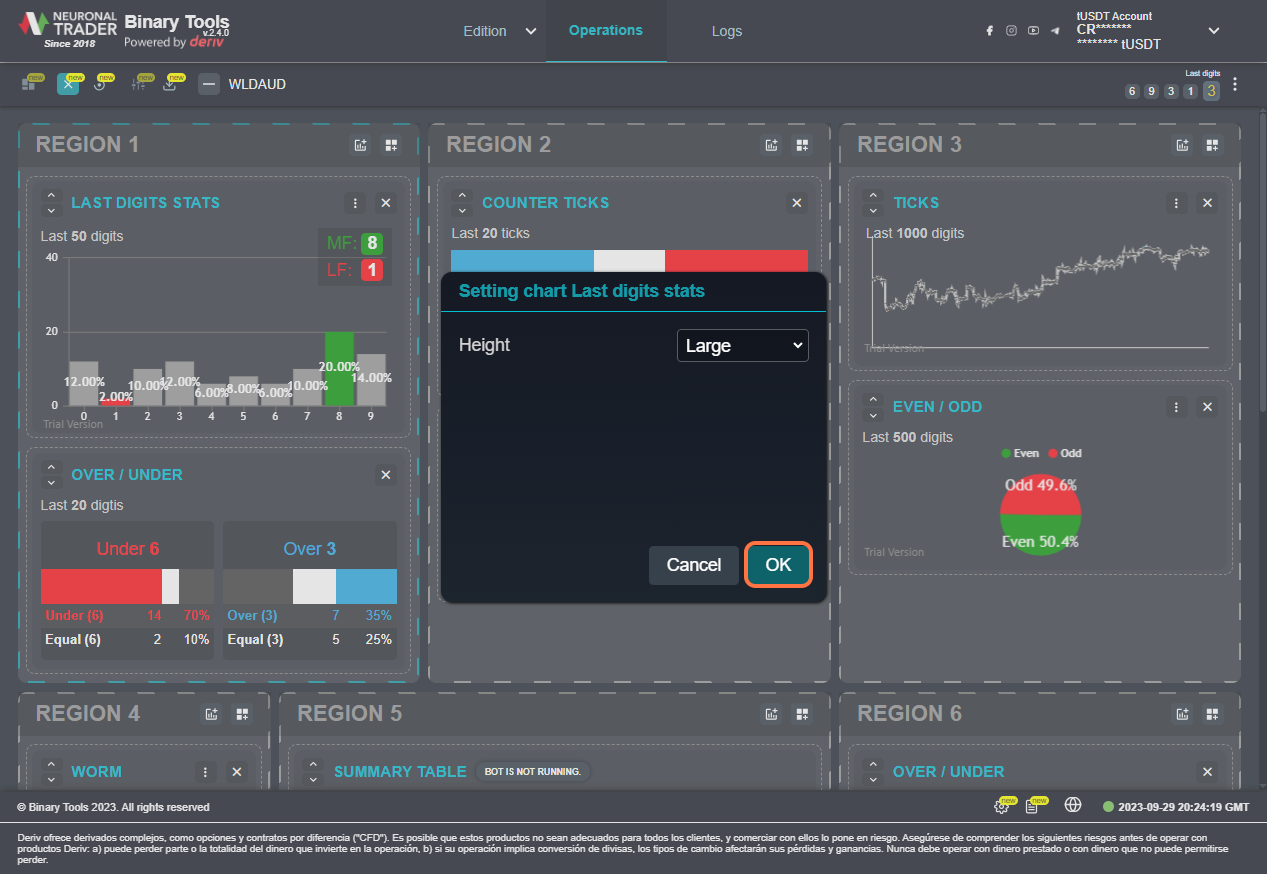
6. Click on Setting chart
To set the height size of the charts, the Summary icon must be located at the top of each chart from the Edit Regions section.
7. Click on OK
It has different preset sizes ranging from Extra small to Large in the different charts.
Select the period that best suits your style and confirm by clicking on the “SAVE” button.
Your opinion is important
As a brand, our mission is to innovate and provide quality products to our community. All the Neuronaltrader team keep working hard to continue adding value to your assets!
If you are part of our community and use Binarytools to automatized your strategy, let us know what do you think about this version. Come into the community and know what others user are talking about Binarytools 2.4
what are you waiting for? Join here!
Important: The information and/or knowledge expressed in this article shouldn’t be taken as investment recommendations or financial advice. All investments and/or actions involve a risk and each person is responsible for researching, educating and analyzing before making an investment decision.


